Note
Go to the end to download the full example code.
Zoom-level dependent labels
If there are many data points, their labels may be difficult to read. To selectively display
labels depending on the zoom level, use the plotly.graph_objects.FigureWidget class and
register a callback.
Hint
You will need to install the anywidget package to use
the plotly.graph_objects.FigureWidget class. See
the Plotly documentation for details.
import functools

import plotly
import plotly.graph_objects as go
import scipy

from pdendro import attach_dendrogram

X = plotly.data.iris()[["sepal_length", "sepal_width", "petal_length", "petal_width"]]
Z = scipy.cluster.hierarchy.linkage(X)

fig = go.FigureWidget()
_ = attach_dendrogram(fig, Z)
The following code registers a callback to change labels on zooming:
def update_ticks(axis, axis_range, all_ticktext, max_n_ticks):
    """Update ticks for limiting the number."""
    step = int(abs(axis_range[1]-axis_range[0])//max_n_ticks) + 1
    axis.update(tickvals=list(range(0, len(all_ticktext), step)), ticktext=all_ticktext[::step])

# axis for data point labels
axis = fig.layout.xaxis

# get all labels
all_ticks = zip(axis.tickvals, axis.ticktext, strict=True)
all_ticks = sorted(all_ticks, key=lambda item: item[0])
_, all_ticktext = zip(*all_ticks, strict=True)

# register a callback
callback = functools.partial(update_ticks, all_ticktext=all_ticktext, max_n_ticks=5)
axis.on_change(callback, "range")

# initialize
callback(axis, axis.range)
The figure can be shown as follows:
fig
Note
The figure is not displayed in the documentation because
the plotly.graph_objects.FigureWidget object can only be displayed in Jupyter.
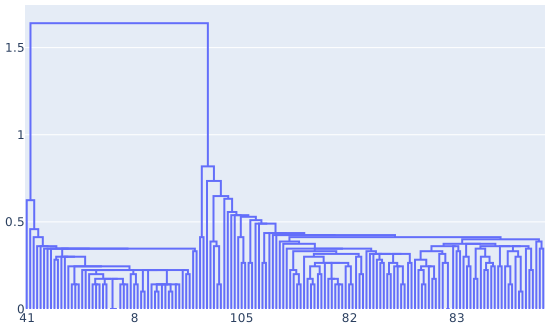
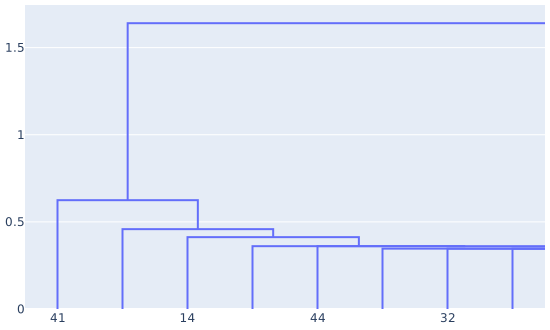
The following images illustrate the appearance at various zoom levels: