Contents Menu Expand Light mode Dark mode Auto light/dark, in light mode Auto light/dark, in dark mode Skip to content
PDendro documentation
  • Tutorial
    • From linkage matrix to dendrogram
    • Showing clusters
    • Inspecting node
  • Examples
    • Layout
      • Radial layout
      • Vertical layout
      • Horizontal layout
      • Subplot
    • Subtree
      • Showing only some clusters
      • Nested subtrees
    • Color
      • Default color
      • Individually specifying subtree color
      • Subtree colorway
    • Data point label
      • Manually specifying labels
      • Zoom-level dependent labels
    • Components
      • Showing all node markers
      • Hiding all node markers
      • Components of dendrogram
  • API reference
    • pdendro
      • pdendro.attach_dendrogram
      • pdendro.make_components
    • Index
  • Glossary
  • License

Links

  • GitLab
  • PyPI
Back to top

Tutorial

Installation

PDendro is published on PyPI. You can install the package by the following command:

python -m pip install pdendro

Basic usage

PDendro provides the attach_dendrogram() function, which visualize a SciPy linkage matrix as a dendrogram on a Plotly figure.
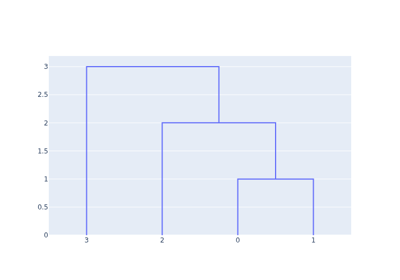
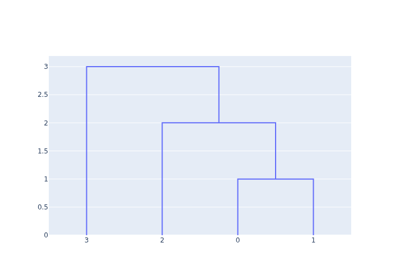
From linkage matrix to dendrogram

From linkage matrix to dendrogram

Inspecting node

Inspecting node

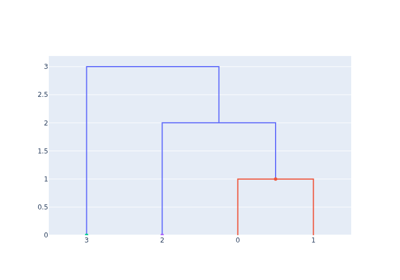
Showing clusters

Showing clusters

Advanced usage

See examples for fine-grained control.

Next
From linkage matrix to dendrogram
Previous
Home
Copyright © 2026 naubuan
Made with Sphinx and @pradyunsg's Furo
On this page
  • Tutorial
    • Installation
    • Basic usage
    • Advanced usage